Fiendish Plots: On the Grid
René Descartes and Cartesian Coordinates
"But I shall not stop to explain this in more detail, because I should deprive you of the pleasure of mastering it yourself, as well as the advantage of training your mind by working over it, which is in my opinion the principal benefit to be derived from this science."--René Descartes, La Géometrié, 1637.

In the Mind's Eye: Spatial Visualization
Continuous and Discrete Values in Graphing
|
|
Graphing Stories
Two types of numerical data scientists, engineers, and leaders encounter when creating graphs to communicate trends are continuous and discrete.
|
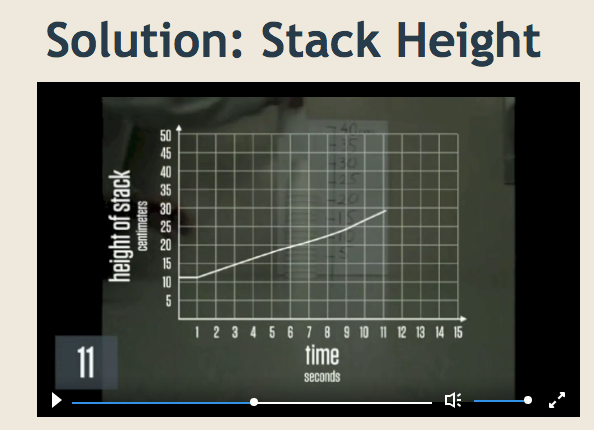
Continuous data may have a range of values, and include fractions and decimals:
Continuous data is often a measured quantitative value, and is displayed as a continuous line segment on a graph or chart, with the axis labeled in units (centimeters, kilograms, liters, minutes).
|
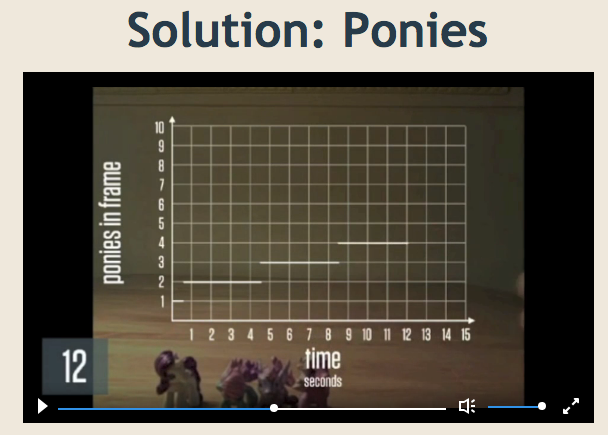
Discrete data can only take certain values:
Discrete data is often a counted quantitative value, using whole numbers, and is displayed as a series of steps or separated line segments on a graph or chart. The axis recording the discrete value will often be labeled in whole numbers.
|
